I use SectorSurfer to manage my retirement fund because there is no other way to compare the available funds to each other except for looking at one performance table that is provided in my retirement account. The table only gives you a percentage gain at a specific moment in time but also doesn’t allow me to visualize the change over time. The question becomes then how do I determine if what is being recommended is the best asset? Furthermore, when you acknowledge a trade in SectorSurfer you have to acknowledge a due diligence statement. It got me thinking that since the software doesn’t have a way to conduct traditional chart analysis (no moving averages, etc.) how do you complete your due diligence? I hope to give you some ideas as to how to do that. Here is my current SectorSurfer Trade Recommendation:
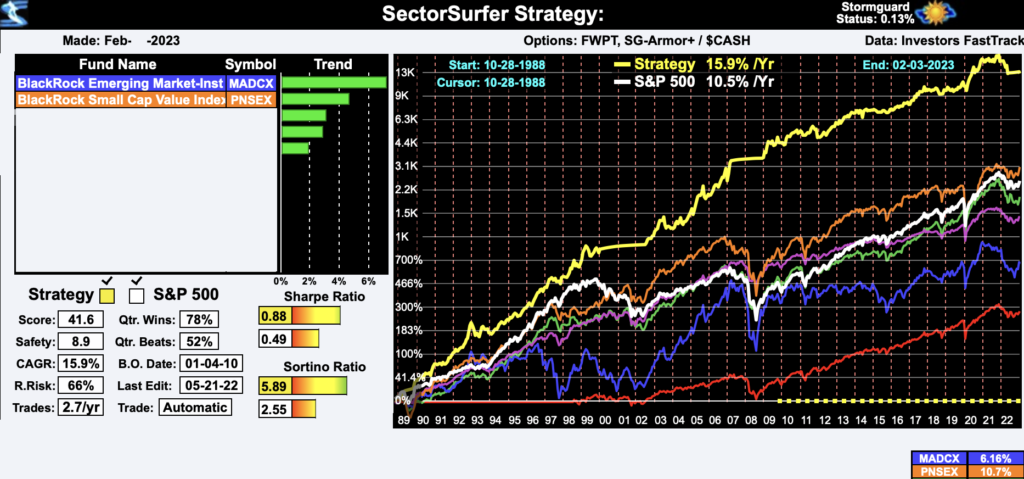
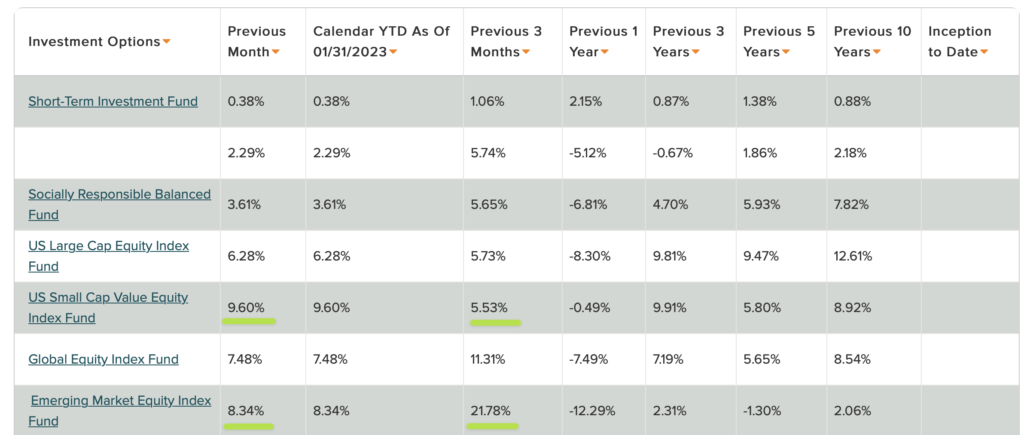
- Look in your retirement fund online and look for the investment performance table provided to check that the listed fund above is actually the best performing. This should line up easily but I should note that when I look at the performance table the 3 month performance of MADCX is the best but on the 1 month time frame PNSEX is performing better. This could be indicating Sector Rotation or this could just be a temporary difference. You’ll have to decide for yourself if this means you want to choose a different fund than is recommended.
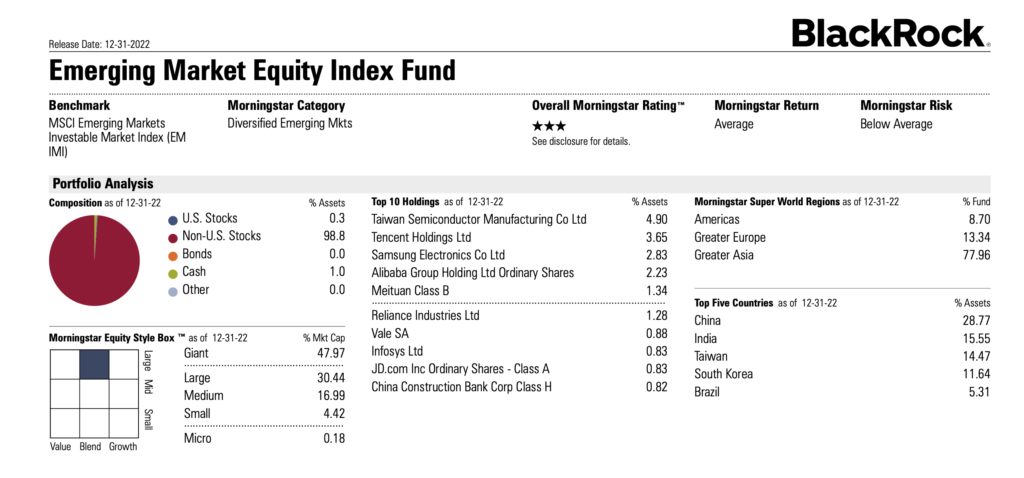
- 2. Find the section that gives you the information about individual funds and what they contain. (A note: notice on the screenshot it gives a previous date, 12-31-2022, for when the information was updated so it doesn’t mean that the balance of assets listed is accurate now. What I mean is that BlackRock held 4.9% of Taiwan Semiconductor on Dec 31st but that doesn’t mean it holds that amount today (4 Feb). Fund Managers rebalance their portfolio and those numbers can change.)
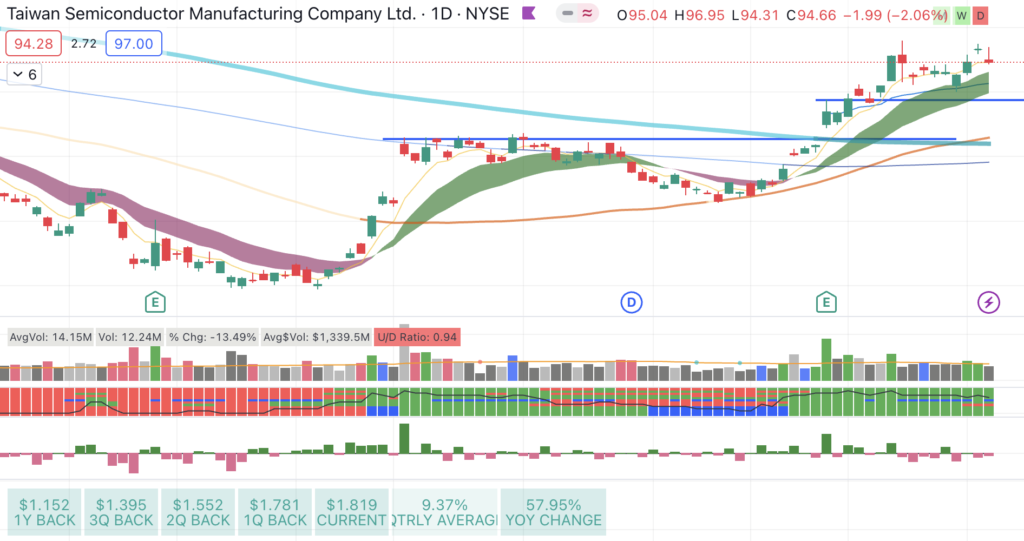
- 3. Look at the charts for the top 3 Holdings to determine how they are performing. From my chart, you can see that currently Taiwan Semiconductor is in an uptrend, It’s price is above the 10 and 20 EMAs, (the green cloud) those are above the 50 SMA (orange SMA) and the 50 SMA has turned upward also. This stock is also in a Stage 2 Uptrend (Stan Weinstein Stage Analysis), and it’s earnings have increased over the last four quarters for a 57.95% year over year change. It’s price has gone up 30.63% since it’s ideal buy point 56 bars ago. If I was trading this stock as an individual asset, I would have sold it 34 bars ago and then reentered 16 bars ago when it gapped up at Earnings. That is a different strategy that isn’t re
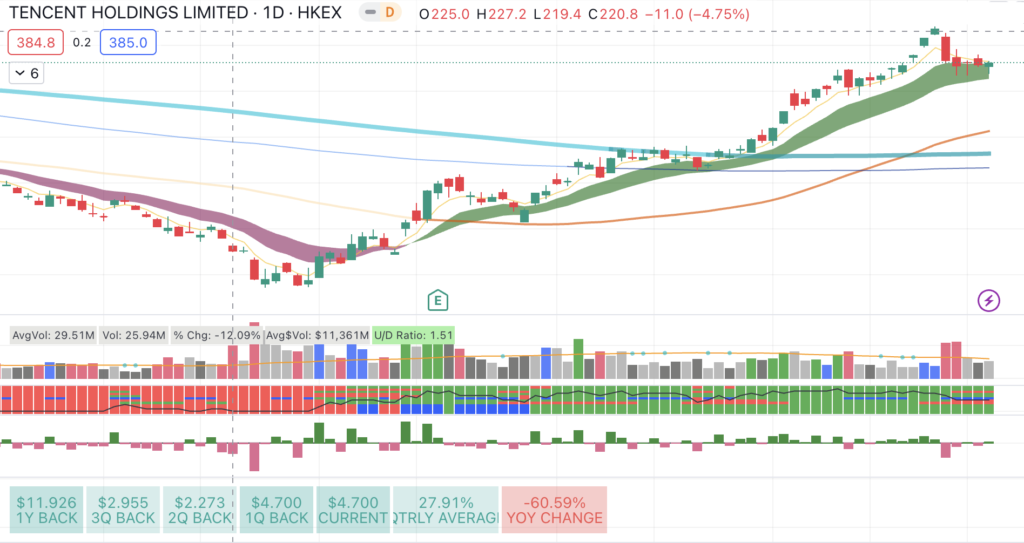
Tencent Holdings looks slightly different. It has been in an uptrend for quite some time but also has the 10 EMA over the 20 EMA over the 50 SMA. However, it’s Earnings are not quite as good (you want to see increases every quarter in a strong stock). It shows a current pullback (to be expected) but if it closes below the 20 EMA that’s not a good sign for the current trend.
Samsung, the 3rd largest holding, experienced a pullback (expected action) but has continued to close above the 20 EMA. It’s 50 SMA is flat when ideally it should be in an uptrend. This chart has a cup and handle but the cup portion is not ideal (the right side of the cup is too vertical when it should be more round. It’s quarterly earnings have not increased every quarter like you would want in a strong stock. Also, there was quite the selloff at it’s last earnings report.

Here is the Small Cap information for contrast.

And the top holding, Ishares Russell 2000 ETF. This also has price above the 10 and 20 EMA and those are above the 50 SMA. The 50 SMA looks flat but also like it might be turning upwards.

Agree Realty has a monster volume bar on the news it will be joining the S&P Midcap. The fact that the stock price closed lower on that much volume and what should be considered positive news might be a bad sign. On the other hand the stock maintained a price above the 10/20 EMAs and stayed in the consolidation area it is forming.

Finally, here is South State. The stock was in a stage 4 downtrend and then started stage 1 and is looking like it might move into a positive stage 2 trend.
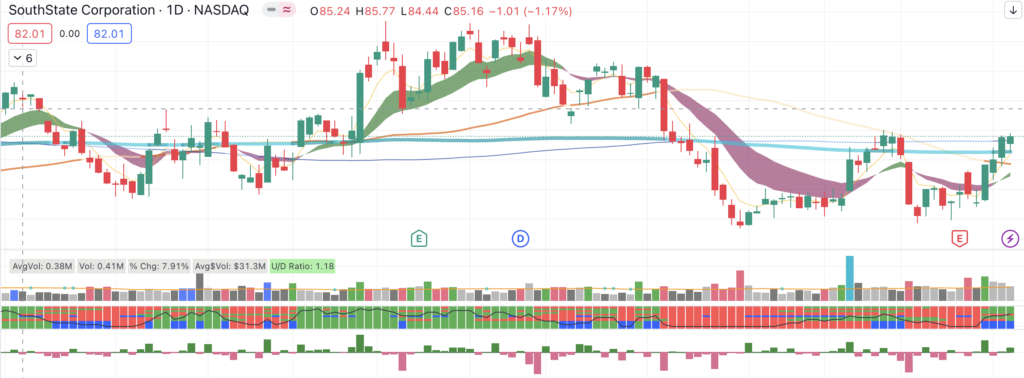
Overall, the two different funds individual charts look mediocre overall but South State’s performance has hurt it’s group and although Agree Realty has been in a positive trend the percentage gain has only been 10.10% since the ideal buy point 61 bars ago. Although, every asset has an effect on the overall fund, by looking at individual stocks, it is clear the performance of Samsung in the Emerging Market fund might detrimentally effect it and in the US Small Cap fund, Agree Realty has the potential to drag performance down. South State might be able to balance that out if it can continue it’s upward trajectory. As you can see, in this case, it’s hard to determine which fund will outperform the other but by looking through individual names I now know which things might hurt the performance of each. You also need to think about where can the stock go? For example, the Emerging Market Fund has already gone up over 21% in 3 months. How much more is it likely to go up in the next month? Well, we know from CANSLIM studies that when a stock has gone up 25% in one move it’s time to think about taking profits. The US Small Cap has gone up 5.5% in 3 months but the last month was over 9% alone. No one knows what a stock will do but it’s strong 1 month performance might be an early sign that this is actually the leader between the two index funds. In the end, their performance is similar and as it stands either is probably fine for now since there is no clear winner.
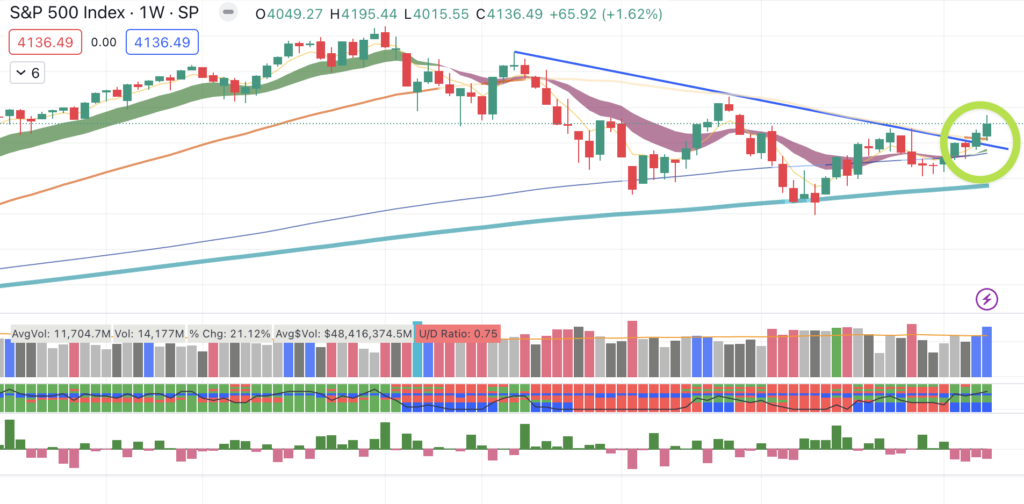
- 4. The final step in the due diligence process is looking at the overall market to see how it is performing. The S&P 500 is usually the benchmark but I should mention, if your fund has all NASDAQ stocks for assets then it makes more sense to look at the NASDAQ when looking at the health of the market. Looking at the below chart you can see the S&P 500 has been in a downtrend for 55 weeks. This past week (ending 4 Feb 2023) the S&P 500 closed above this downward trend line for the first time. This is a positive sign for the market and would indicate it’s ok to open some small positions. The one thing about retirement funds is, in most, although it’s possible to move positions around, it’s not possible to set stops so really keeping an eye on your account is important.
For the record, I went with the buy recommendation from SectorSurfer before doing the due diligence process. I’m pretty sure the recommendation is wrong and that the US Small Cap will outperform the Emerging Market Fund. I’ll check back on March 1st to report the results.
Update 3/2/2023: As mentioned I followed the SectorSurfer recommendation to buy the Emerging Market Fund but then after my research (see previous paragraph from a month ago) I felt that the US Small Cap Fund would outperform it. Unfortunately for my retirement account, I was right.
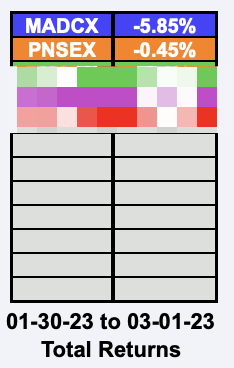
As you can see, neither strategy came out on the positive side but the Emerging Market Fund performed far worse. Even though I am not showing you the other funds in my strategy, they fell between the percentages of the Emerging Market Fund and the Small Cap Fund. In other words, the selected Emerging Market fund performed the worst out of all five options and the Small Cap Fund performed the best. This is why it’s important to perform due diligence BEFORE following a strategy.
Check out the list of investing books I read over and over to learn more about investing and technical analysis.